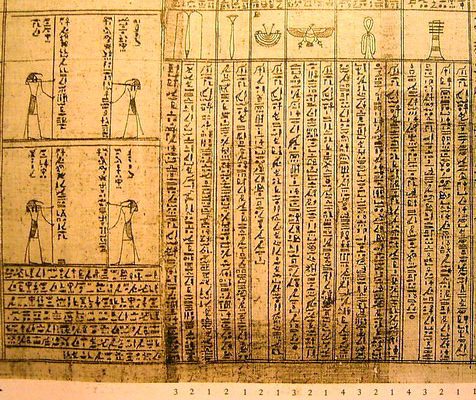
The Egyptian Museum of Turin hosts exceptional finds that testify to the activities of an incredible people. Among these, one of the oldest known geological documents, which took the name of the "Turin Papyrus". It dates back to the 1150th Dynasty period of Ancient Egypt, around XNUMX BC and is particularly significant because it is an important testimony to the ancient Egyptians' ability to conduct geological investigations and to use this information and maps for practical purposes, such as mining and construction.
From this first known testimony, over time humans have perfected analysis tools and types of tracking. Today maps are not only used to orient ourselves in the space that surrounds us today, but also in the time that awaits us tomorrow.
In other words: with maps today we predict the future.
Powell's prophetic vision
In addition to being a renowned explorer, John Wesley Powell he was also a visionary. His map, titled “Arid Region of the United States: Showing Drainage Districts,” was a mosaic of colors representing the diverse freshwater sources of the American “wild west.” There were 22 in total: each marked by a color on the maps. Each told a story, showing variations in terrain, rainfall, rivers and streams.
This map was not only an authentic work of art, but a powerful communication tool. Powell wanted to show the US Senate how dry the western region was compared to the east, and how limited water resources were. But there was more: the map predicted future events, such as a terrible sandstorm (which occurred in 1930) and the drying up of the Colorado River, which occurred even a century and a half later, in 2023.
If Powell were alive today, he would be amazed at the transformation of maps over the years.

The rebirth of maps in the XNUMXst century
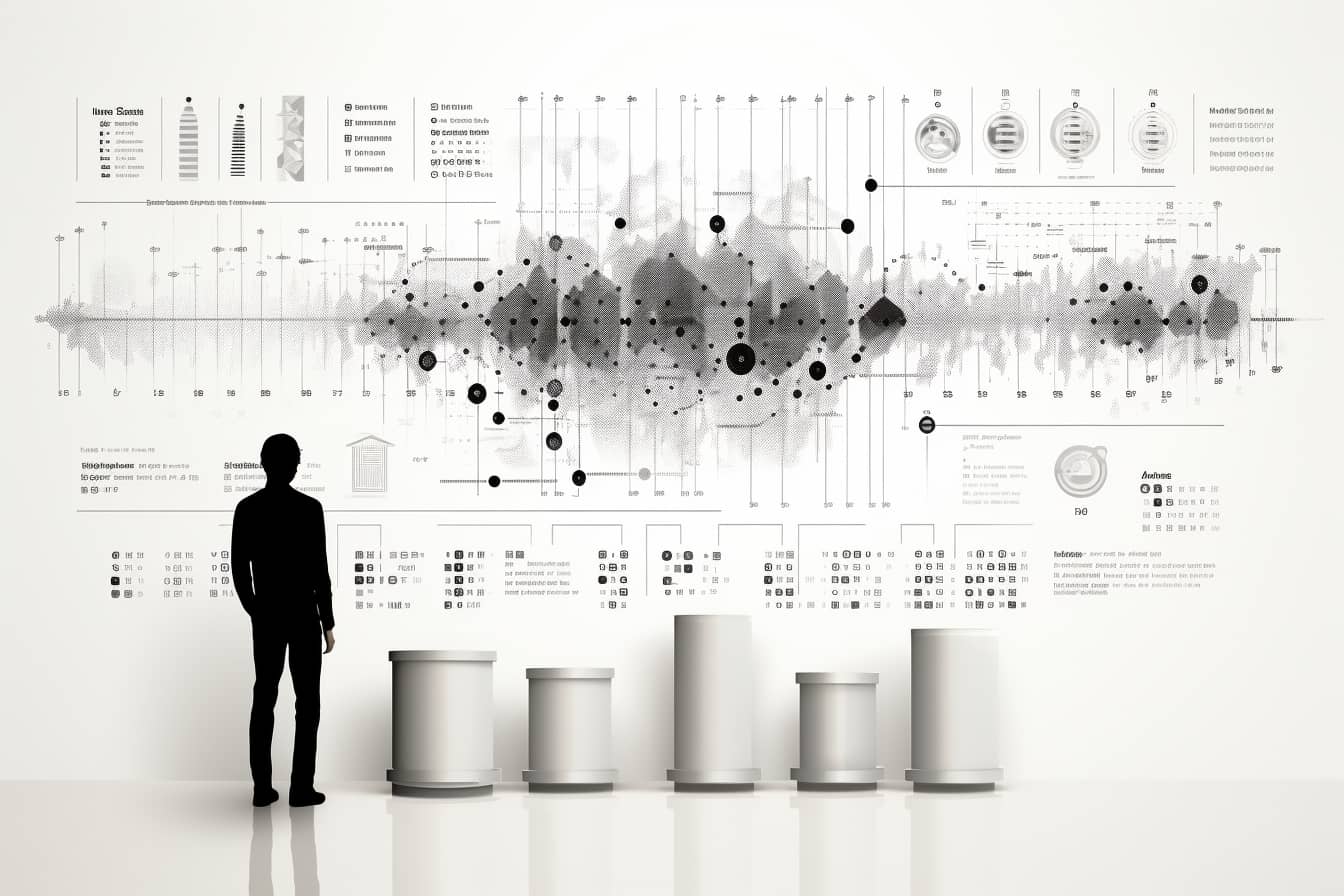
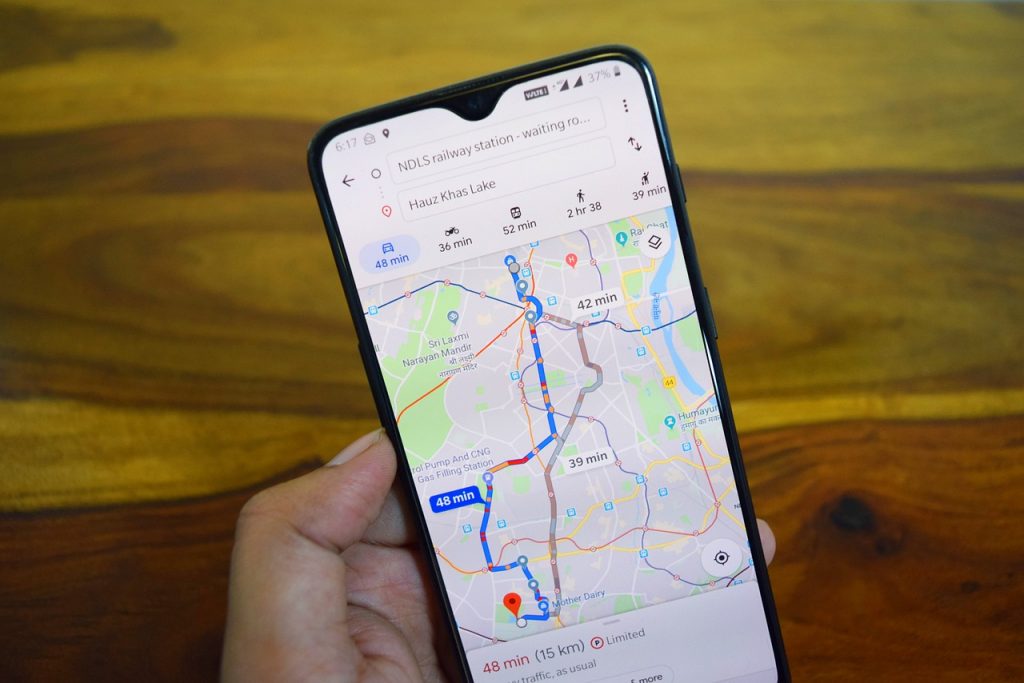
With the advent of technology, as mentioned, maps have become much more than simple geographical representations. Now they can predict the future of our trip, show us radar images of incoming storms and even help us plan our day based on the weather forecast. Maps, in short, have become the data visualization tool par excellence. But it's not just that: modern maps have the power to influence decisions, policies and even the course of history.
Over the last 10 years in particular, maps have gained incredible new capabilities. Today, asking what a map can do is in fact asking what a satellite or a computer can do. Maps can show us our world in ways we never imagined. They can focus on both problems and solutions: for example, a simple question like “Where are there gaps in broadband internet coverage?” can now be answered in a few minutes thanks to modern technologies GIS technologies. And it's not just about identifying gaps, but understanding who is disadvantaged by those gaps and how to fill them effectively.
What is this?
GIS technologies, or Geographic Information Systems, are computing tools used to capture, store, manipulate, analyze, manage and present geospatial or geographic data. These technologies allow users to visualize, query, analyze and interpret data to understand relationships, patterns and trends in visual forms such as maps, graphs and reports.
Among the main characteristics and applications of GIS technologies:
Spatial Analysis: With GIS, you can perform complex analyzes to determine, for example, the proximity between different points, the area of a particular region, or the best route between two places.
Data Integration: GIS can integrate and overlay multiple datasets on a single map, allowing users to see how different geospatial data relates to (and perhaps influences) each other.
Data Management: GIS offers tools to manage and maintain geospatial databases, ensuring that data is accurate, up-to-date and easily accessible.
Prediction and Modeling: GIS technologies can be used to create predictive models of the future based on geospatial data. Just like John Wesley Powell's map, but with incredible precision and effectiveness.
Maps of the future
As technology evolves, maps will continue to play a crucial role in our society. I think about CMRA, a powerful mapping tool for resilience and adaptation to climate change. This map, launched in the US, can show how vulnerable any location is to the impacts of climate change and can help make informed decisions about how to address these challenges.
Intelligence and deep learning lead to traffic maps like that developed by MIT able to predict accidents before they even occur.
There are also several “future” maps to consult online, if you are interested. Here are some:
- Leolabs: Even if the Earth is flat (right?) with this map you can keep track of everything in Earth orbit. Link to the map.
- Ventusky: These maps provide real-time views (and forecasts) of weather data for any location on Earth. Here is the link.
- Interactive World Maps by Kaspersky: These maps offer predictions about the future in an interactive globe. Users can choose a time horizon (up to 2030, 2040 or 2050) and discover various predictions. Link to the map.
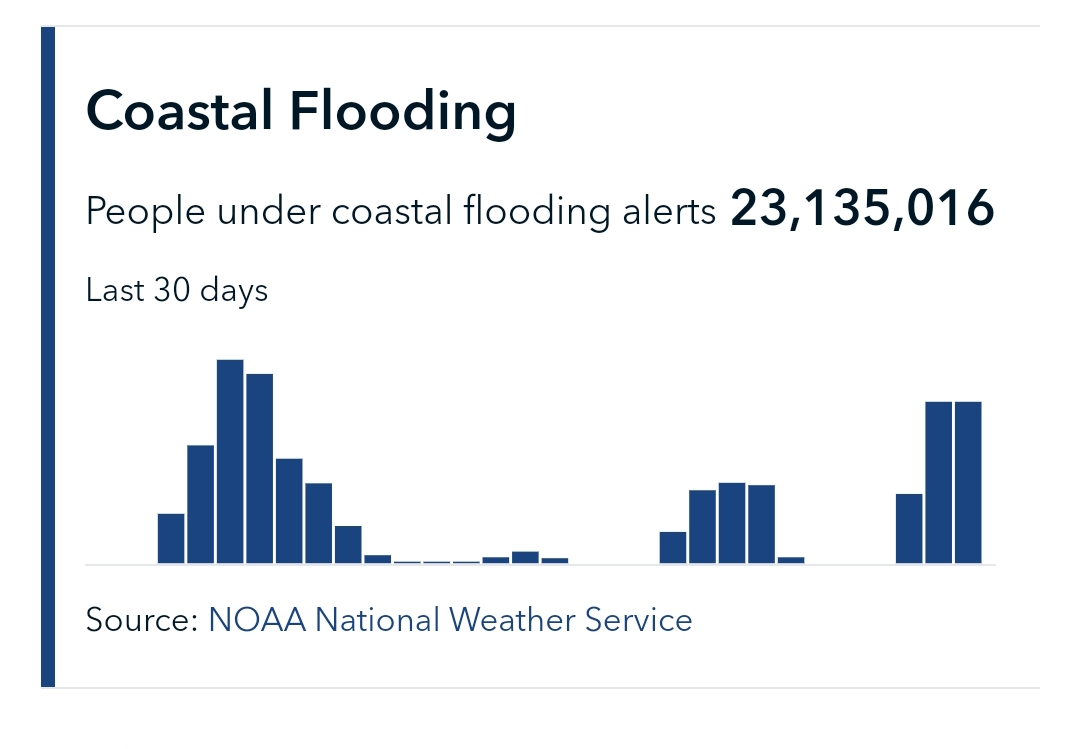
- Sea Level Rise and Coastal Flood Risk Maps by Climate Central: Global interactive maps showing areas threatened by sea level rise and coastal flooding. Link to the map
- Volcano Discovery: interactive maps showing volcanic activity and earthquakes taking place across the planet. Here is the link.
- Statsilk: a list of over 400 interactive maps of the world covering areas such as health, education, drugs and crime, economy, environment, gender and population for all countries. Find everything here.
In short (Italian only)
The Turin papyrus, Powell and all those that followed have demonstrated that maps have the power to change the world. They are practical tools, but also aspirational. They help us understand what is there, but also to imagine what could be there.
In an ever-changing world they will always be at our side, guiding, informing and inspiring us towards a better future.